Study area
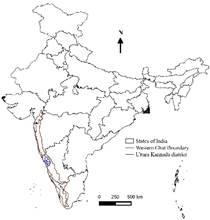
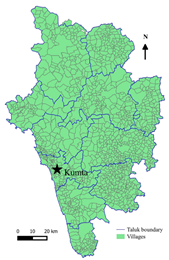
Kumta, a coastal taluk in Uttara Kannada district, Karnataka State is located between the Arabian Sea coast on the west and Sahyadri ranges (Western Ghats) on the eastern side (14.42°N and 74.4°E). Taluk spreads over 590.45 km2 of area with population of 1,54,515 (Census 2011). Taluk is blessed with lush green forests which cover more than 65% of the geographical area and about 16% of the area is under agriculture/horticulture or plantation. Figure 3 shows the study area with annual average solar insolation and wind speed.
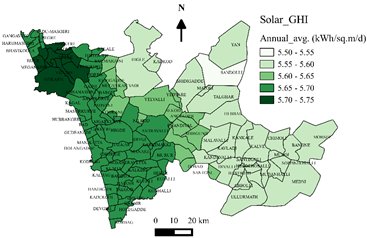
Spatio-temporal data are used for energy potential assessment using open source GIS platform, which also gives the seasonal and geographical variability of the available energy resources. Long term data sets acquired from NASA SSE (Solar GHI) and Climate Research Unit (CRU) (Wind Speed) are reliable and depicts the seasonal variability which is closely correlated with ground measurement [11 - 13]. Taluk experiences abundant solar insolation of more than 5.5 kWh/m2/d throughout the year in all the villages. Coastal villages experience higher insolation compared to eastern villages which connects the taluk to Western Ghats ranges. However, decentralised generation can meet the significant electricity demand in all the villages. Figure 4 shows the seasonal variability of the solar energy potential across the villages. During summer (February to May) Kumta experience solar insolation of more than 5.6 kWh/m2/d which reduces to less than 5 kWh/m2/d during Monsoon (June to August). The radiation reception also varies in these months which will affect the electricity generation. During winter (October to January), taluk receives insolation ranges from 5 to 5.5 kWh/m2/d.
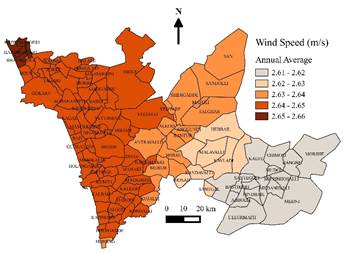
Figure 5 gives the wind speed variability in the taluk across the months. The coastal villages experience higher wind speed of more than 2.65 m/s annually compared to the eastern villages (2.61 m/s). Though the variation in annual average wind speed is minimum, seasonal variation is higher due to the swift winds during monsoon. During summer and winter, taluk experiences lower wind speed which ranges from 2 to 3 m/s. During monsoon taluk experience speedy winds varies from 3 to 4 m/s. Solar and wind resources supplement each other which supports hybrid energy systems in the region.
|
|
Uttara Kannada district, India |
Village wise annual average solar insolation (kWh/m2/d) |
|
|
Kumta taluk, Uttara Kannada |
Village wise annual average wind speed in Kumta (m/s) |
Figure 3: Study area – Kumta taluk, Uttara Kannada, Karnataka, India
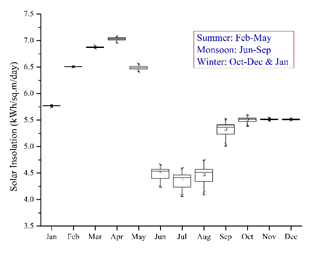 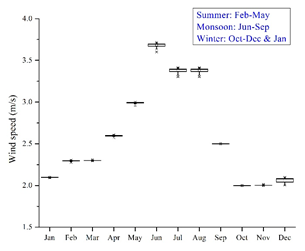
Figure 4: Solar insolation variability Figure 5: Wind speed variability
Table 2 lists land use and land cover (LULC) details of Kumta taluk, blessed with bioenergy resources as most of the people practice agriculture/horticulture, which is the primary income of livelihood. About 16% of the total geographical area is under agriculture/horticulture or contains coconut and areca plantations which generates large amount of high energy residues such as coconut shell, rice stalk etc which can be used in bio-gasifiers. The taluk has 21.4% of evergreen forest, 12.5% semi-evergreen/moist deciduous forest, 7.3% of dry deciduous forest and 3.4% of acacia plantations which ensures the availability of plant residues with higher energy content throughout the year. These plant residues are being used for domestic purposes and sufficient quantity is available to use as a fuel for bio-gasifiers towards electricity generation.
Table 2: Land use land cover (LULC) details of Kumta taluk
Category |
Area (Ha) |
Built up |
1727.6 |
Cropland/Agriculture |
5149.2 |
Open space |
5984.0 |
Coconut/Areca |
4428.9 |
Semi-evergreen/Moist-deciduous |
7370.5 |
Evergreen |
12638.4 |
Scrub/Grass |
15190.2 |
Acacia |
2018.8 |
Dry-deciduous |
4351.5 |
Total |
58859.63 |
Regional Integrated Energy Plan (RIEP)
Integrated energy plan essentially explores the locally available energy resources and feasible energy conversion technologies to meet the regional demand. The energy planning exercise carried out for Kumta taluk involves minimisation of annual cost function to a set of equality and inequality constraints using linear programming (LP) algorithm. The main objective of the energy planning is preparation of location specific decentralised energy harvesting systems for meeting the regional energy needs. This ensures least cost to the environment and the economy. Centralised energy generation and transmission cannot pay much attention to the variations in socio-economic and ecological factors of a region which influence success of any intervention. Decentralised energy planning focuses on efficient utilisation of resources, while ensuring more equitable sharing of benefits from development [14]. The integrated energy planning mechanism take into account of all resources available and end use demand of a region. This implies that the assessment of the demand and supply, and the intervention in the energy system which may appear desirable due to such exercises, must be at a similar geographic scale. Resource assessment done using remote sensing data with geographic information system (GIS) and field data compilation. Regional integrated energy model based on DG minimises the operating cost while ensuring reliable sufficient energy supply and ensures the total energy supply. The process is a constrained optimisation problem where, maximum available energy from each resource and minimum energy requirement for every end use are considered as constraints. Figure 6 illustrates the procedure adopted in the study.
The present study deals with the village wise potential assessment of renewable energy resources in Kumta taluk of Uttara Kannada district, Karnataka state. The district lies in the central Western Ghats (WG) which is one among 35 biodiversity hotspots in the world. District is a repository of diverse endemic flora and fauna and also receives higher solar insolation for about 300 days in a year. The coastal villages of Kumta, experiences greater wind speeds which are high wind energy potential areas. Taluk also receives higher insolation which encourages the solar power plant installation. Spatio temporal (across villages and seasons) variability of resources have been analysed to optimise the energy harvesting with best locations as well as efficient end-use energy devices. Harvesting solar and wind energy ensures the availability throughout the year as wind compliments the lower solar insolation period during monsoon. Further, number of end uses and available resources are identified. Resource-task matching is modelled where the linear programming (LP) is used for optimisation. Cost minimisation is also explored while meeting the total energy demand with available local resources.
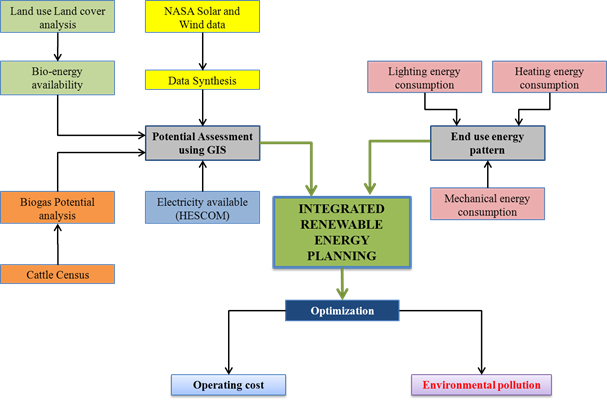
Figure 6: Integrated energy plan at regional levels
System is designed to use only locally available renewable energy sources which however have lower pollution. End use energy requirement per capita is assessed and total energy requirement per end use is computed and validated with field data. Table 3 gives the energy requirement for different end uses in the taluk.
Table 3: Energy requirement for different end uses
End use type |
Energy required (GWh/annum) |
Low temperature heating |
485.0 |
Medium temperature heating |
411.7 |
Low power mechanical |
6.2 |
Medium power mechanical |
43.4 |
Lighting, fan etc. |
37.2 |
Total |
983.5 |
Low temperature heating (<100°C) end uses such as water heating for bathing, agro-processing (drying of local agro products such as areca nut, coconut, cashew, pepper etc.) etc. has the highest share (485 GWh/annum) in the total energy required followed by medium temperature heating (411.7 GWh/annum) and medium power mechanical end uses (43.4 GWh/annum). The agro processing activity which includes drying of areca nut, coconut, cashew nut, cardamom and other spices requires lot of low temperature heat energy (80-100°C) throughout the year. Direct electricity consumption is only for lighting, fans and television in homes, commercial spaces and road lights which consumes about 37.2 GWh/annum. Table 3 shows the efficiency of the energy conversion processes to meet the end use energy requirements.
ηij
|
Low temp heating |
Med. temp heating |
Low power mech. |
Med. Power mech. |
Lighting, fan etc. |
Solar |
0.4 |
0.3 |
- |
- |
0.1 |
Wind |
- |
- |
0.4 |
0.4 |
0.3 |
Biomass |
0.15 |
0.15 |
- |
- |
0.3 |
Biogas |
0.65 |
0.6 |
- |
- |
0.35 |
Electricity |
- |
- |
0.8 |
0.75 |
0.8 |
Table 4: Energy conversion efficiency
The efficiencies of various energy conversion technologies are estimated from literatures and few are computed. However, these values do not overestimate the output energy obtained by energy conversion. Table 5 gives the load factor assumed in the present energy planning process. Maximum energy availability from each resource in the taluk has been computed by converting available quantity into its corresponding energy equivalent. Abundant solar energy is available (both solar thermal and electric energy) in the taluk where the harvestable energy is about 2860 GWh/annum. Similarly, about 670 GWh/annum of energy can be extracted from biomass and agro-horti residues in the region. Annual energy availability from all the resources in the village is given in Table 6.
kij |
Low temp heating |
Med. temp heating |
Low power mech. |
Med. power mech. |
Lighting, fan, etc. |
Solar |
0.29 |
0.35 |
- |
- |
0.35 |
Wind |
- |
- |
0.3 |
0.2 |
0.35 |
Biomass |
0.29 |
0.35 |
- |
- |
0.35 |
Biogas |
0.29 |
0.35 |
- |
- |
0.35 |
Electricity |
- |
- |
0.65 |
0.65 |
0.65 |
Table 5: Load factor
Resource |
Energy potential (GWh/annum) |
Solar |
2860.6 |
Wind |
39.44 kWh/m2 of swept area |
Biomass |
670 |
Biogas |
12.9 |
Electricity |
30.5 |
Total |
3574.17 |
Table 6: Available maximum energy potential
The wind energy harvesting depends on the swept area of the wind blades. The taluk has more than 31 km of coast line on the west which can generate ample energy from wind resource. Depending upon end use energy requirement, micro (few watts) to small scale (few kilo watts) wind generator can be installed in the coastal villages for irrigation and electricity generation. Wind plants can also be integrated with solar or bioenergy plants which can address the intermittency issues. Energy available from biogas and electricity is limited to 0.1 GWh/annum and 0.43 GWh/annum respectively. The optimised operating costs for meeting the end use from available resources is shown in Table 7.
Cost (INR/annum) |
Low temp. heating |
Med. temp. heating |
Low power mech. |
Med. power mech. |
Lighting, fan, etc. |
Solar |
49494102.3 |
0 |
0 |
0 |
0 |
Wind |
0 |
0 |
19711392.7 |
73755336.96 |
0 |
Biomass |
153862.2 |
448498.1 |
0 |
0 |
52893514.4 |
Biogas |
0 |
0 |
0 |
0 |
24679188.6 |
Electricity |
0 |
0 |
0 |
8945.3 |
0 |
Total Cost (INR) |
22.11 crores |
Unit cost (INR/kWh) |
0.22 |
Table 7: Optimised cost matrix of the energy model
Total operating cost of the model is found to be INR 22.11 crores per annum with unit cost of INR 0.22 per kWh of energy utilised. Cost of generating mechanical energy from wind resources is found highest (INR 7.3 crores) followed by solar thermal energy generation (INR 4.9 crores) and generating electricity from biogas (INR 2.46 crores). However, electric energy application for medium power mechanical end use has the lowest operating cost (INR 8945.3) where the electricity is directly obtained from grid. Total energy supplied for various end uses is about 983.5 GWh/annum from all resources. Table 8 gives the energy supply patterns from resources to different end uses.
Table
Energy (GWh/annum) |
Low temp. heating |
Med. temp. heating |
Low power mech. |
Med. power mech. |
Lighting, fan, etc. |
Energy utilised |
Solar |
250.9 |
0 |
0 |
0 |
0 |
250.9 |
Wind |
0 |
0 |
6.2 |
12.8 |
0 |
19.09 |
Biomass |
234.05 |
411.7 |
0 |
0 |
24.2 |
670 |
Biogas |
0 |
0 |
0 |
0 |
12.94 |
12.94 |
Electricity |
0 |
0 |
0 |
30.53 |
0 |
30.53 |
End use energy supplied |
485 |
411.7 |
6.2 |
43.4 |
37.2 |
983.5 |
8: End use energy supplied from various resources
Energy harvested from solar resource is about 250.9 GWh/annum which is used to meet the low temperature heating requirement. Wind energy resource is used for low (6.2 GWh/annum) and medium power mechanical (12.8 GWh/annum) end uses contributing about 19.09 GWh/annum. Ample biomass resource is available in the taluk which is utilised for low (234.05 GWh/annum) and medium temperature heating (411.7 GWh/annum) and also to generate electricity (24.2 GWh/annum). Similarly, biogas is used for electricity generation (12.94 GWh/annum) and grid electricity supply is utilised to meet the medium power mechanical end use energy requirement (30.53 GWh/annum). Model is successfully simulated the resources and end use combination to generate feasible solution with minimum operating cost. However, it can also be inferred that, taluk can meet all the energy needs from locally available resources while maintaining efficiency and minimum cost. Since the energy system utilises renewable energy sources, significant greenhouse gas (GHG) emission can be avoided which is an essential step to reduce global warming. This model will generate employment in the village level which contributes to the development of the region and energy security.
|